Rental investors
Compare income properties on an all-in basis.

 Sign inStart free trial
The buy-and-hold lens starts with NOI and an all-in cost basis, then compares yield with the city and applies location, HOA, debt and Florida-condo risk gates.
7-day free trial, no card required.
Top of today's Orlando list
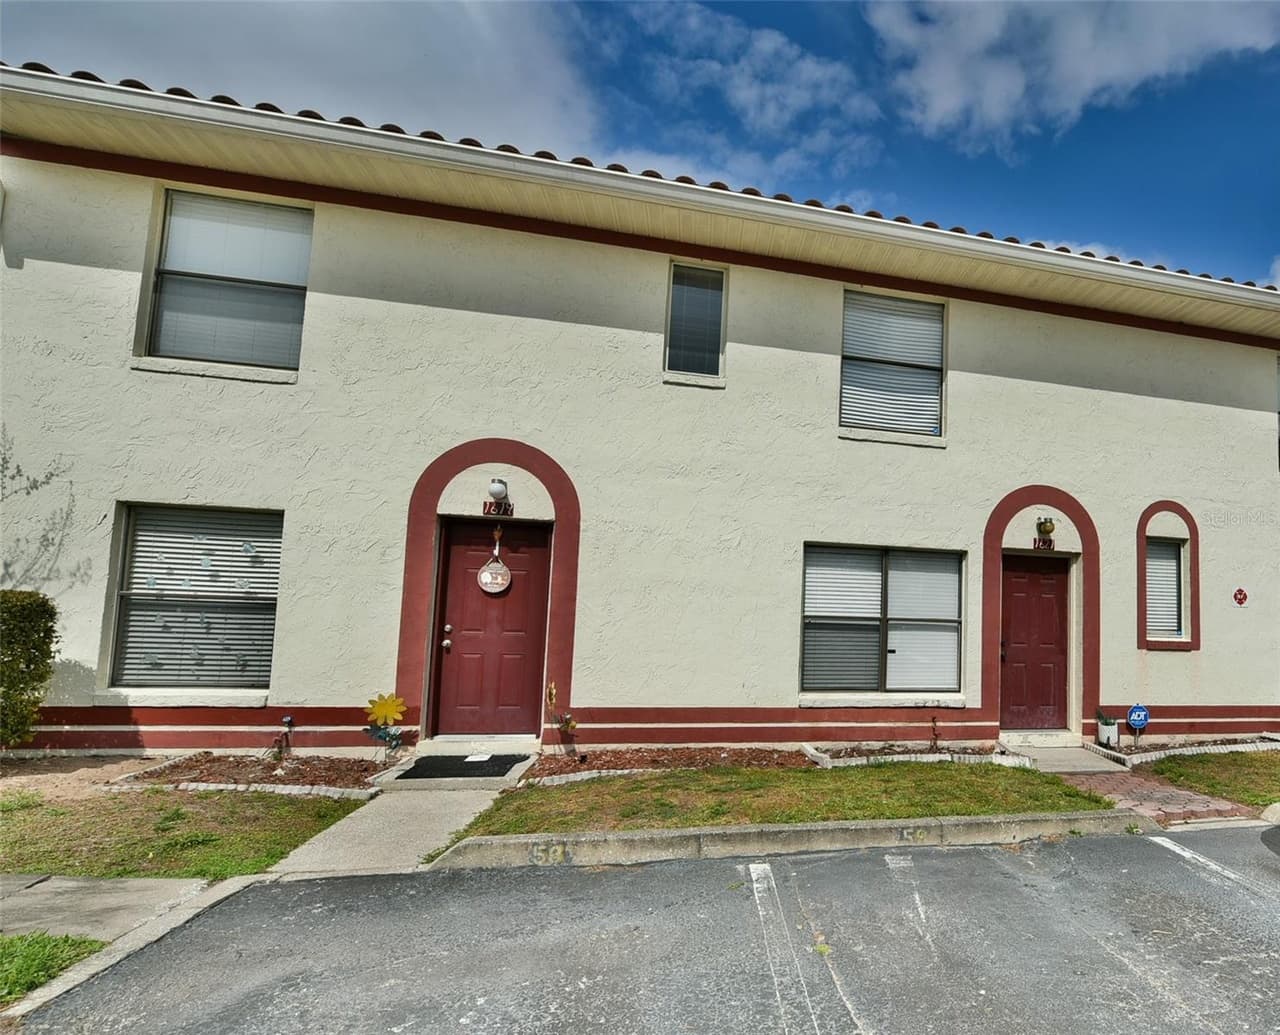
2 beds · 2.5 baths · 1,104 sqft · $179,900 · 44 days listed
8.9%Cap rate (all-in)#1 of 2,151 in OrlandoTop tierEstimated 8.9% cap rate on an all-in cost of $179,900Positive cash flow of about $463/month after debt service at 25% down (DSCR 1.53, cash-on-cash 11.4%)Estimated rent of $2,446/month, a published estimateCompare income properties on an all-in basis.
Show the rent, NOI, cap rate and sold comps together.
The lens uses estimated rent, NOI, all-in basis, city-relative yield, appreciation, schools and amenities, HOA cost, debt coverage and Florida condo risk where relevant.
1621 Sandy Point Sq #61, Orlando, FL 32807 in Orlando is #1 of 2,151 for the buy & hold lens in the latest published list.
Top tier
8.93% cap rate on an estimated $2,446/month rent (NOI $16,061). Gross yield 16.32%, above the local median of 15.34%.
Nothing about a listing changes. The question does.
The top three listings per city for this lens. The rest, listing agent contact and the full score breakdown are for members. Pick a city.
Three listings to explore. Open any card for a closer look.
Growth fits the way this lens is usually worked. Every plan includes all five lenses; zip codes stay filters inside each city.
Green means the listing is in the top 5% for this lens inside its city. Amber means the top 20%. The raw score and letter grade are shown, but they do not choose the colour.
Yes. Open the score anatomy to see weighted components, their drivers, ordered adjustments, confidence, percentile, caveats and the engine's plain-English rationale.
Redfin and MLS listing data are live. Zillow and Realtor.com are coming soon, under Next on the roadmap.
Use the city percentile tier to decide what to inspect first, then open the components, adjustments, caveats and source fields before acting.